The art of developer documentation
One of the least favorite things most developers like to do is writing technical documentation. But that doesn’t change the fact that it’s equally important as writing code. Let’s see why…
- someone in your team developed and maintained a component in your stack, but that person has now left the company and you have to take over. You open the repository…and you see a blank readme file. You can’t believe that person didn’t document the component!
- and oh, remember that complex software system you wrote a year ago and have to add a new feature to now? You probably forgot how it worked…and worse, you didn’t document its design. This won’t be fun to figure out…and will probably take twice as long to implement.
- your company is rapidly expanding and hiring new people. With every new hire you have to explain to them the same thing again and again, how tiresome!
Good documentation solves all the above problems. Just like an excellent set of unit/integration tests, it saves you and the team time in the long run.
Diagrams
Let’s start with a cornerstone of good technical documentation, diagrams!
A good diagram is worth a thousand words, if it’s a good one…
However, many diagrams are just a set of boxes that say nothing about how the system works. You see these typically in high-level system “diagrams”.
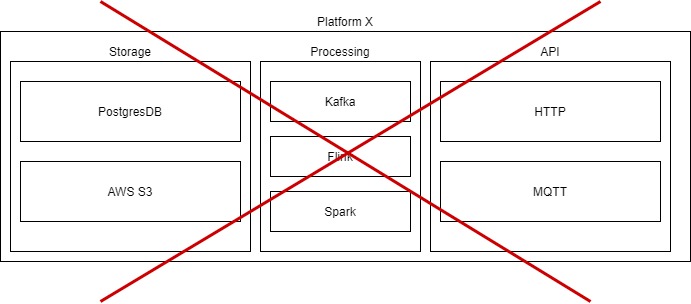
Don’t make these your go-to diagram type for technical documentation! These have their purpose when you just want to list features or components of a platform, but make for poor technical documentation.
So, what’s an excellent technique to document a software system? That’s where the C4 model comes in.
The C4 Model - Documenting software systems
The C4 model is a powerful way to visualize software systems. It comprises 4 (zoom) levels that allow you to create meaningful diagrams. For each level they illustrate the systems/containers/components/actors involved and their relationship to each other. I highly recommend reading up on this on the excellent c4model.com site, made by Simon Brown, the original author of the C4 model.
Let’s go over each of the four levels.
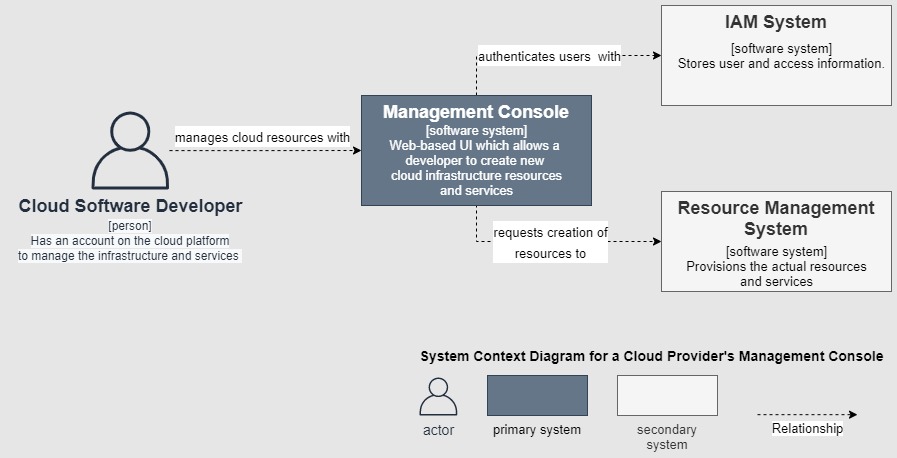
Level 1 - System Context diagram
The highest level and ideal to show the structure of the system and its actors.
In this scenario we need to document the system through which developers can manage cloud resources (servers, volumes, applications, …) on cloud platform X. This diagram only shows the high-level systems and actors that are at play in this scenario. We display the Management Console, the primary system we want to document, centrally in the diagram.
Things to note:
- I gave the diagram a proper name and legend, so that the purpose and components of the diagram are clear.
- I mentioned no technologies
- each block on the diagram has an indication of its type (person, software system) and a brief description
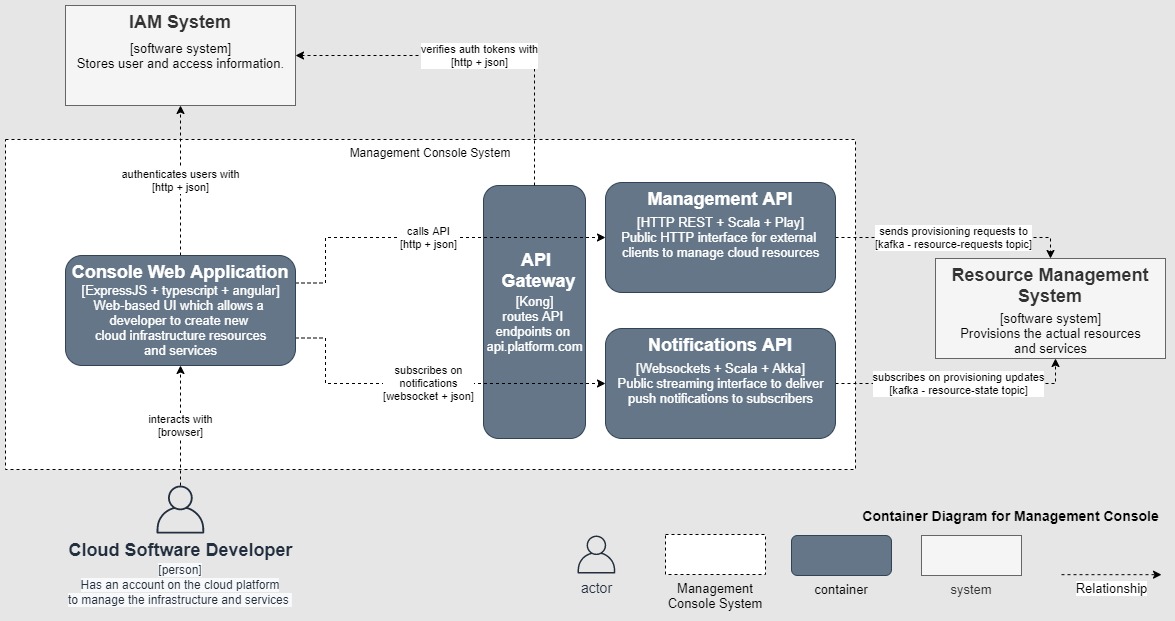
Level 2 - Container diagram
Zooms in to one system by showing the containers (apps, databases, data streams, …) and their interactions. Here we zoom into the Management Console system.
Things to note:
- I introduce technologies into the diagram, both for the containers and their interactions
- I still mention related systems, but they take a backseat
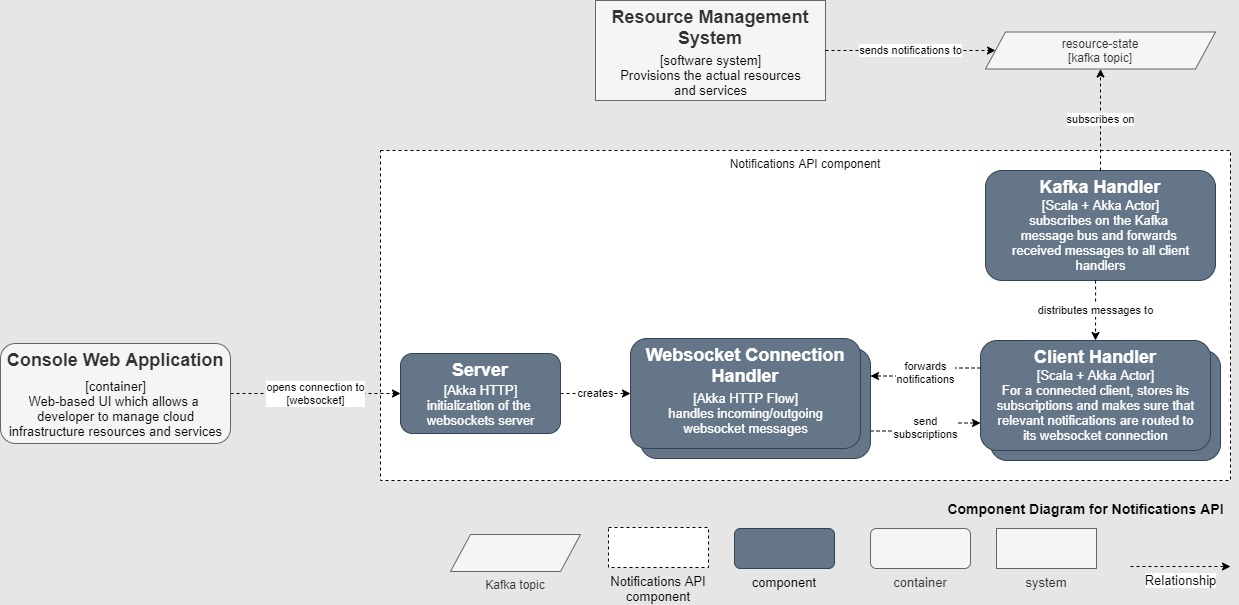
Level 3 - Component diagram
Takes one container and shows the components within that container. We can easily identify these components in the codebase, because they form the high-level structures. In this diagram, we zoom into the Notifications API container.
Level 4 - Code diagram
Typically, a UML diagram. I rarely use these and would only recommend them if you zoom into part of your code that might benefit from having its structure displayed, otherwise a UML diagram gets messy quickly.
Flow Chart diagram
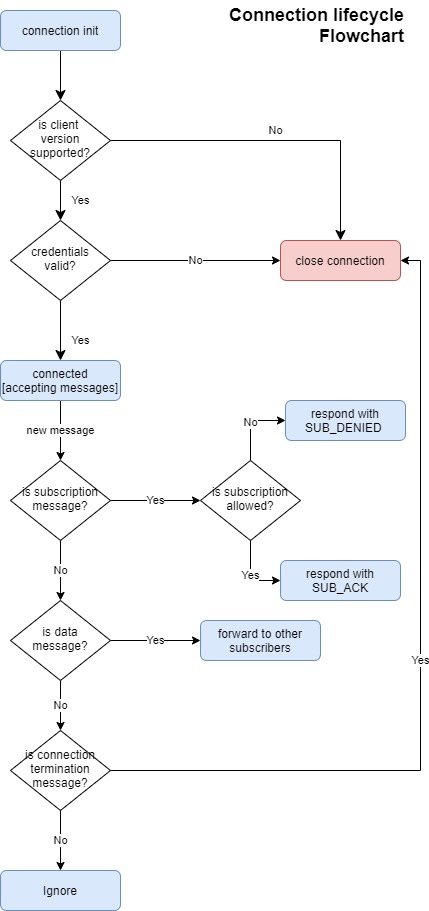
While the C4 system is great, you will also need some other diagrams to augment it. One of these is the flowchart diagram, which is great for visualizing complex logic with multiple branching paths and decisions.
Take this example of a connection lifecycle flowchart:
Swimlane Flow diagram
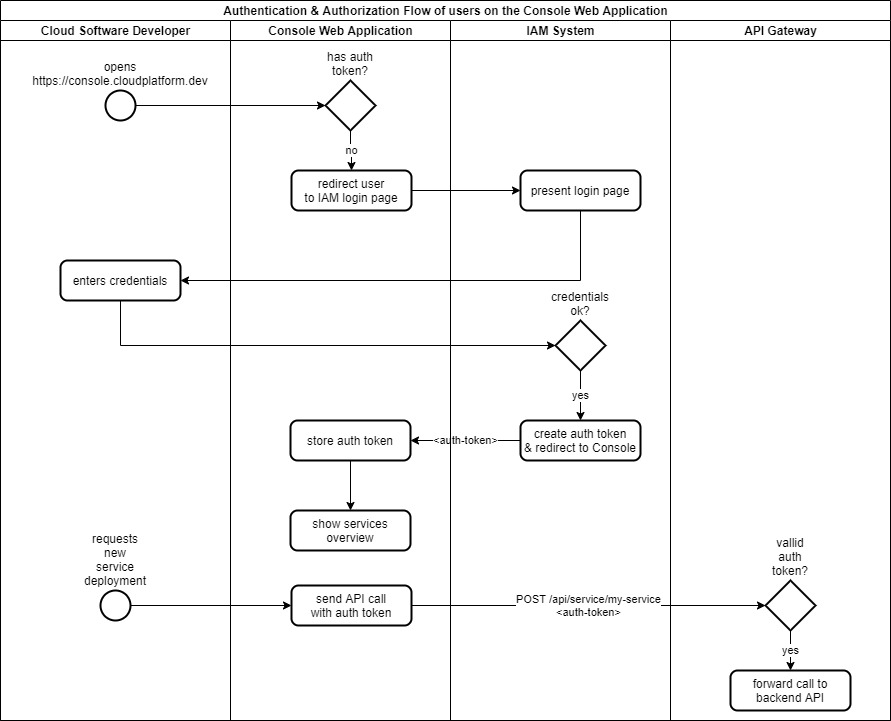
Variation on the standard Flow Chart diagram, but allows you to make a clear distinction in which component or actor handles which action. I typically use these when I want to visualize a flow between multiple components.
Take this example swimlane flow diagram, to visualize a rudimentary authentication and authorization system of a user interface.
Tools
Diagram tools I typically use are the desktop versions of diagrams.net (aka draw.io) and yEd. Both are free to use, and while not focused on creating software diagrams, do the job just fine in my experience.
Technical Feature documentation
When working in a team on a large project, you will need a proper way to document the design decisions that are made to implement a feature. Not only to get everyone on the same line during the implementation phase, but also as a reference after the feature has been implemented. This avoids the common “Why did we implement it like this? I remember it had a good reason, but I can’t remember anymore, so better not touch it!”.
In my experience, it’s important to create a design document first, which explains what you’re going to build. It makes you think up front and allows an easier review process, but also makes for excellent documentation on how the various features in your system work. And yes, during the implementation process, things might still change, but then it means just a minor change to the design document. If you don’t do this up front and not make it part of the process, chances are it will never get documented.
In open source projects, you can find similar efforts, such as Apache Kafka KIPs (Kafka Improvements Proposals) and Apache Cassandra CEPs (Cassandra Enhancement Proposals).
Software Component Documentation
A good readme
Every repository of a component should have a good readme file, so that new developers can get up to speed quickly. It should:
- at the top of the document, have a short description of the component describing its function within the system
- a more in-depth feature list, describing the functionalities that are provided by the component. e.g. supported authentication mechanisms, APIs that it exposes, data that it transforms, …
- a C4 Component Diagram, which shows the major sub-components, their interactions and the place of the software component in the wider system.
- document technologies decisions (framework, language, build tools, libraries), conventions and other architectural component decisions.
- mention related repositories: the other containers it interacts with, or important libraries that are being used
- have a getting started guide for developers:
- requirements: what to have installed on your system
- configuration: how to configure the component for development
- build instructions: how to compile, run tests and package the component
- release & deployment instructions: How to make a release of the component and how to deploy it
Component logic
Next to a good readme, you can have other component documentation that describes the implementation in more detail. This is where you can make use of flow/swimlane diagrams to visualize complex logic, discuss internal systems and, dare I say, UML diagrams where necessary.
Operating the component
When your component is going to run in production, you also have to describe how to operate it properly. This document will have to answer at least three key questions:
- start/stop/restart/scale actions: what to consider? Can we restart them with no issue? Scaled them to many instances? Are there certain limitations?
- metrics: what are the key metrics exposed by this service and what’s their meaning?
- Incident handling: in case something goes wrong, how to troubleshoot and where to look for more information (logs, metric dashboards, …)?
- important configuration variables