Stream Processing: Basic Concepts
Businesses more and more process user generated and machine generated data, with the goal of analysing, transforming and acting on that data. User generated data typically has the lowest volume of the two (e.g. user adds item to shopping card). Machine generated data typically has the highest volume (e.g. a sensor generating metrics every second). Traditionally, businesses only had to process a limited amount of data and therefore they could process the day’s data overnight. But with the increase of gathered data-points, this isn’t always workable anymore. Also, users and businesses want to see and act on data in real-time. This is where stream processing comes in, which allows you to process a continuous stream of data either in (micro-) batch or real-time. This article will try to give you an insight into the high-level concepts of stream processing.
What is a data stream?

A data stream is a continuous stream of data. Multiple devices or processes can publish data to this stream or consume data from it. The rate of data coming into the stream can be rather constant or highly irregular.
The data stream can be persistent or non-persistent.
Non-persistent streams provide their data to all those who are subscribed at the moment the data gets published. All those not subscribed at that moment in time are out of luck and will not receive that data. A protocol which implements such a non-persistent data stream is MQTT (given that you don’t use a persistent session).
Persistent data streams store the data for x amount of time (also called the retention time). This allows multiple consumers to consume the data at their own pace and time or to read data from a certain point in the stream. This is certainly useful when you’re working with large amounts of data or bursts of data. A protocol which implements such a persistent data stream is Kafka.
The data format of a data stream can be anything, typically textual formats such as Json or binary formats such as Protobuf, Avro or MessagePack. Textual formats have the benefit that they are humanly readable, but are bigger and slower to parse, so most suited for low-volume data streams. Binary formats have the benefit that they are highly compressed, so much smaller and faster to parse, which makes them ideal for high-volume data streams.
What is a stream processing job?
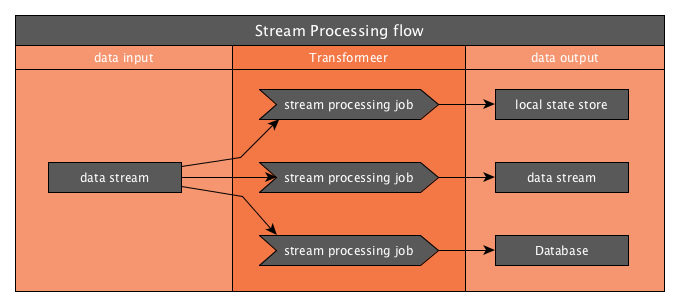
A data stream is the ideal input for a stream processing job. The job will consume and process the stream’s data and output the result to a certain destination. It will process the messages on the stream either:
- in batch: the job will only sporadically read in the data, batching up the data in a larger chunk and processing it at once.
- in micro-batches: the job will process the data at a rather regular interval, and will process rather small chunks of data each time.
- in real-time: the job will continuously consume data from the data stream and process the records one-by-one. You can do this on either a persistent or non-persistent data stream, but it all depends on whether you’re allowed to lose data.
The more interesting implementations of a data stream allow multiple consumers to consume the same stream. That way, multiple kinds of stream processing jobs can process the same data differently and output their results to different destinations. The destination can be pretty much anything, going from another data stream to a database, cloud object storage, …
What is a message log?
Let’s start with the definition of a message log:
A log is an append-only sequence that is ordered based on time.
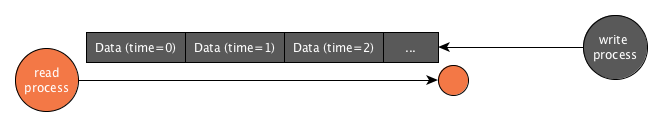
With a log, new messages are always appended at the end of the log. If we’re going to read the log, we’re always going to read it from oldest to newest. Some message log implementations allow you to read from the beginning of the log (oldest messages), from a certain offset within the log, or from the end of the log (newest messages).
Now, what is a log primarily used for? Logs are primarily used to store a history of events in a time-based sequence. When we’re looking at software-based events, then think about an update (event) of a user record or a device sensor that published a metric (event) at a certain point in time.
That way, if we’d publish all update events of a user’s account to a message log, we’d be able to replay those events from beginning to end and see the evolution of the user’s account data. Or we could even replay up to a certain point in the log, to reconstruct the account based on those events and see how it looked like at that certain point in time.
Interesting fact: many database implementations also use a log in their implementation. They write all their events (create, update, delete) to the log. Based on these log events, the database then overwrites the state of the record. With certain techniques, it’s even possible to traverse this database log, which has its own interesting use-cases.
A message log looks suspiciously like a data stream. That’s because it’s a kind of persistent data stream implementation. A stream processing job can consume this message log from a certain offset until the most recent offset, and can then wait until another process publishes new messages to the log.
For example, you can have an IoT device which publishes sensor metrics to the log, whereby a stream processing job will consume those metrics and transform them, and output them to a database for visualization.
How to scale a message log?
So what if one stream processing job can’t keep up with processing the data that is published on a stream? I hear you think “just add another processing job”. But then, when job A and B are both reading the stream, how does job A know which messages job B hasn’t processed, so that no duplicate work is being performed? Clearly, we need a way so that multiple processing jobs of the same type can process the data of a stream in parallel, whereby each job processes a unique set of data within that stream.
That is why many message log implementations split up a stream’s log into partitions.
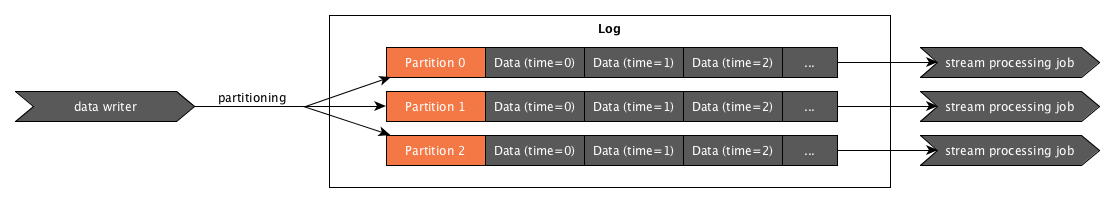
When partitioning a log, each partition will contain a piece of the log’s data. The publisher will determine the partition on which to publish data by using a partitioning key (e.g. the user id). The publisher will translate this partitioning key to a certain partition number based on a formula that considers the number of partitions. By using such a partitioning formula and a partitioning key, all data of a certain user will end up on the same partition.
Because we publish the data across all partitions of a stream’s log, we lose the overall ordering of the messages on the stream. This isn’t necessarily a problem because we still have a strict order within each partition. So the events of each user (when partitioned by user id) will end up on the same partition, in sequence.
By partitioning our stream, we can now run multiple instances of our stream processing job, whereby each instance processes a unique partition of the stream. Now we can process data in parallel, which means we can process data at a much faster rate.
How to make a message log more resilient to data loss and outages?
So, what if the disk that is holding your message log’s data breaks down? Suddenly you’ve lost all data, which typically is something you want to avoid. If you’ve made regular backups of your message log, you might still be able to restore quite a bit of the data. But still you will probably have lost the most recent records and have an outage which can last hours (or worse, days!).
Typically, message log implementations solve this issue by making the message log distributed. They run multiple instances of the log with each different disks underneath them. Then, while data is being published to the log, it will replicate the data across the instances. When one disk breaks, we still have that data available on the other instances, which the distributed message log can still serve to consumers.
Of course, the more duplicates we store, the more storage we’ll need. That’s why you can typically configure a replication factor for the log, which defines how many times the data needs to be replicated. The higher the replication factor, the safer you are, but the higher the hit on storage and performance.
Summary
To see all this in action, you can explore the Kafka Visualization by SoftwareMill. Kafka is a distributed message log, and this visualization allows you to play with the number of instances, partitions and replication factor and see the effect on the message in the log.